Rukuku Mediaboard for iPad: speak, draw, collaborate in groups


Rukuku Mediaboard is awesome

Rukuku Mediaboard For The iPad enables voice and image collaboration for groups. Free!

Our first iPad App is now available in the App Store!

Rukuku Mediaboard is awesome: speaking and sketching in groups has never been easier. When you download and install the app, make sure to allow the App to access your iPad’s microphone and contacts when you first fire it up.

Once you are registered with Rukuku, invite your friends, students and colleagues using the Invite icon in your media board. Enjoy the conversation when they join.

For comments and questions, please email 54321@rukuku.com


Straight out of the box: Testing ‘cognitively demanding’ tasks

Last post on these PISA results, I promise. As I mentioned last week. US students are not great at applying math to real world problems. But, according to the OECD’s report, students in the US are good at “reading data directly from tables and diagrams – requiring students only to understand a short text and read single values directly from a representation provided such as a table or bar diagram.”

PISA, OECD, United States

Standardized tests attempt to assess more complicated thinking.

Wow. Seems US students are good at reading charts. They are also good at taking information directly from tables and inserting numbers into formulas already given to them. In other words, the super boring stuff. They are less good at applying any of those numbers and formulas to real world problems; that outside the box type of stuff.

This makes one wonder, or at least makes me wonder, if our strength on easy stuff and difficulty with hard stuff might ironically result from our emphasis on standardized tests. The teach-to-the-test approach seems like it would offer students a whole bunch of opportunities to read from charts and plug stuff into formulas without necessarily connecting any of that to real world situations. In other words, maybe we’ve been going for the low hanging fruit by banging these simple processes into students’ heads.

The US does seem to test more often than other countries. In the US, 80% of students attend schools where student data is posted publically and virtually all students in the US attend schools that track achievement data over time. Those numbers compare with OECD averages of 45% and 72%, respectively. For a country with weak math skills, we do seem to love our data.

Does having all that data mean we are testing more? Maybe not, but probably it does. The report also notes that the US is one of the only countries that relies not only on testing at the national level, but at regional and other levels also.

The Common Core was designed to help us improve our scores. I hope it does. Well, I hope it helps us improve our analytical skills, thus improving our scores. The OECD seems to think it will help and mentions the new standards multiple times throughout the report. A shift from plugging numbers into formulas to more “cognitively demanding” tasks should clearly be a welcome one.

Still, I wonder if any standardized test can really capture the important skills involved in “outside of the box” thinking.  And if not, then how do we determine whether our educational policies are really working? Any opinions on this from our readers?

Another Slice of PISA: Socioeconomic factors weigh heavily on US students’ test scores

I wrote about the OECD’s annual standardized test earlier this week, the PISA (Programme for International Student Assessment), and today I am going to write about it again. Repetition is the key to these standardized tests, you know. In this particular post, I’d like to take a look at a few of the more subtle details from the report released by the OECD together with the results.

PISA, OECD, socioeconomic status, education

The OECD’s PISA test shows that socioeconomic factors strongly influence educational outcomes.

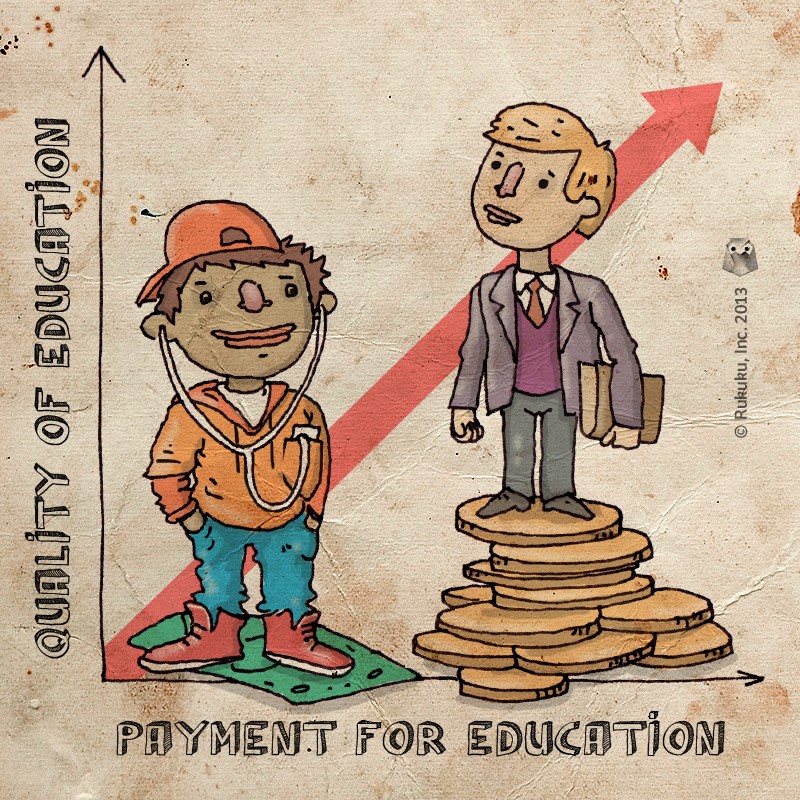
The first of those details is a big one because it relates to money.  According to the OECD’s report, socioeconomic differences account for a 15% variance in the testing outcomes in the US, compared to less than 10% in Finland, Norway, Japan, and Hong Kong. In other words, two students from different socioeconomic backgrounds are more likely to perform differently on the PISA in the US than in most other OECD countries. And it is not the student on the lower end of the financial spectrum that performs best.

Also, the OECD has a special classification for super rad students that are among the lowest 25% socio-economically but still perform in the top 5% academically. They are called “resilient.” In the US, only 5% of low income students classify as resilient, compared to 7% on average and around 15% for Hong Kong, Macao, Shanghai, and Vietnam.

This seems like it should be a strong point for the US. American dream, social mobility, all that, but as it turns out, it is the opposite. Ironically, unlike many other countries, the US does not show a big difference in the student-teacher ratio or teacher education levels in lower performing schools. So what is that difference? Facilities maybe? After school programs?  I’d be very interested to hear any ideas in that big comment box below.

In terms of school performance, some interesting results came up as well. First, across all the OECD countries, schools with more autonomy tended to perform better. So, the more control the principal had, when combined with accountability measures and strong principal-teacher interaction, the better the students did.

At the same time, there was no cross-country evidence that competition among schools in any way contributed to better student performance. In other words, students at schools that compete to enroll more kids performed at the same level as students that are pretty much stuck with their schools.

On the positive side, or not really, the US did score well in opinions about our own math skills. This comes despite a below average ranking in math. For example, 69% of respondents felt confident in their ability to calculate figures such as the gas consumption rate of a car. The OECD average was 56%. So, at least we are confident. And have warning lights for low fuel.

U. S. Ain’t: The US shows no progress in international education test

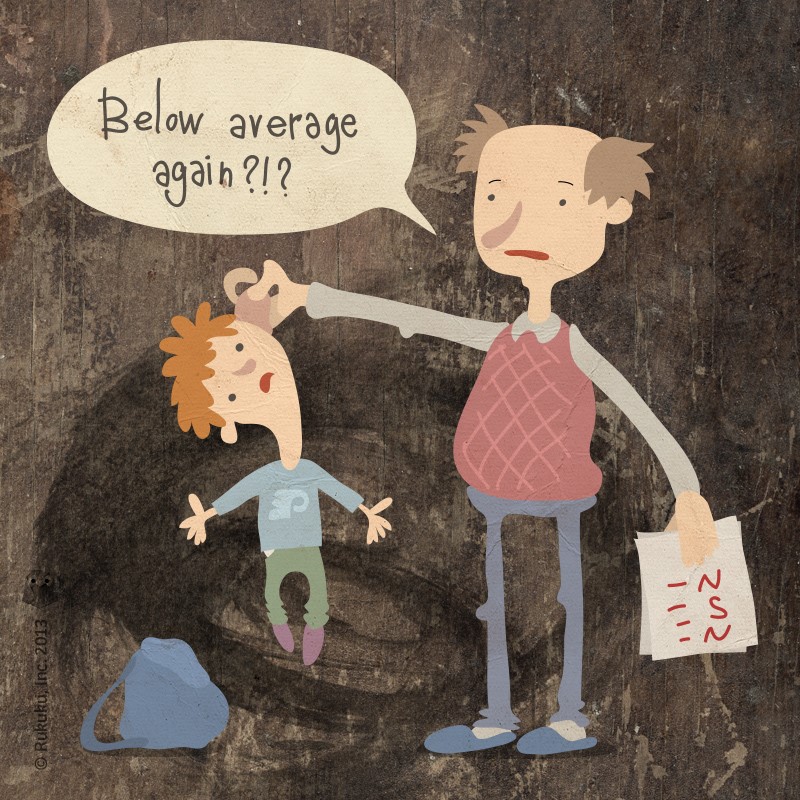
The world is ending. Or at least it is in America. Or at least it is in American schools. After years and years of bold educational reforms, 15 year-olds in the US scored just about where they always have, when compared to students in developed countries around the world: about average in reading and science, lower in mathematics.
US education. PISA, OECD

Despite years of reform, the US continues to perform poorly on the OECD’s PISA test.

Surprising no one, students in East Asian countries knocked it out of the park, and those in Europe did pretty well, too. Meanwhile, among the 34 OECD countries, the US scored 17th in reading, 21st in science, and 26th in math. The margin of error is about three there, for all the optimists and pessimists out there.

The poor performance comes despite spending a ton of money. Among all the countries surveyed, the US had the third highest per capita income, and only Austria, Luxembourg, Norway, and Switzerland spend more per student. To illustrate, the Slovak republic spends around $53,000 per student and performs at the same level as the United States, which spends $115,000. Yikes.

And yea, it gets worse. The US did particularly poorly in measures of critical thinking. Things like, applying mathematics to real world problems. This is supposed to be our strong point. Or at least that’s what I always thought. Like, maybe we drop out of school like Bill Gates, but we still think outside of the box and all that. These test results seem to indicate otherwise.

Of course one might wonder how a standardized test can legitimately measure a student’s ability to think critically. For example, a student with strong critical thinking skills might realize that there are few personal rewards for doing well on these tests.

But then, maybe that attitude is just the problem, a reflection of our American individualist way of looking at life. I am not going to get into all that now, other than to say I always tried my best on standardized tests.  I promise.

So, what next? The OECD says that the Common Core standards should help. We’ve discussed those standards in our blog here and plan to discuss them more. One of the main selling points of Common Core standards is that they emphasize critical thinking. It is tough to prove that one way or the other, especially when standardized tests are actually “the box”, in that “think outside the box” metaphor. But it will be interesting to see.

We will dive into these results a bit more in the next blog post. Meanwhile, don’t lose heart. We still have Bill Gates, Warren Buffet, and Bob Dylan.

Rukuku At Kevin Kelly’s Cool Tools Show And Tell

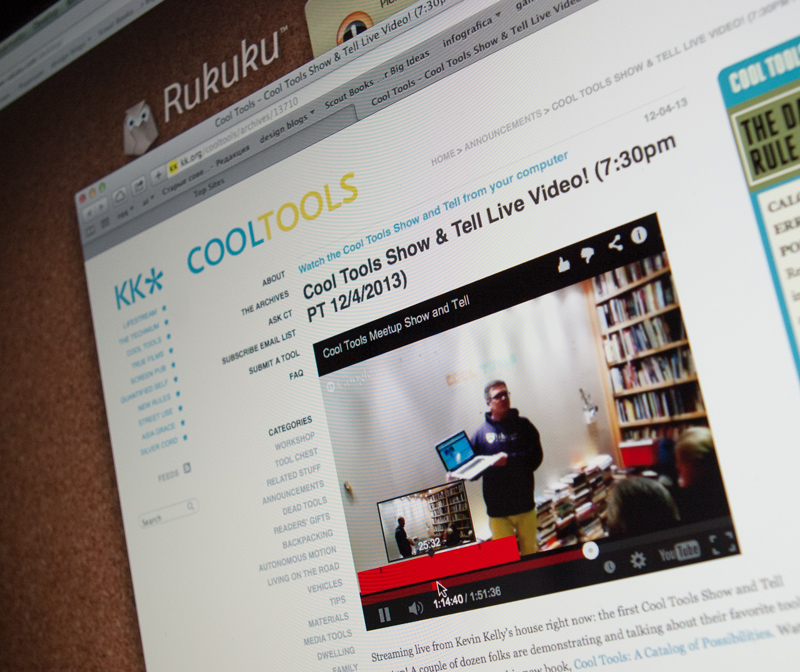
On December 4, I had the honor of showing Rukuku’s toolset at Kevin Kelly‘s first ever Cool Tools show and tell.
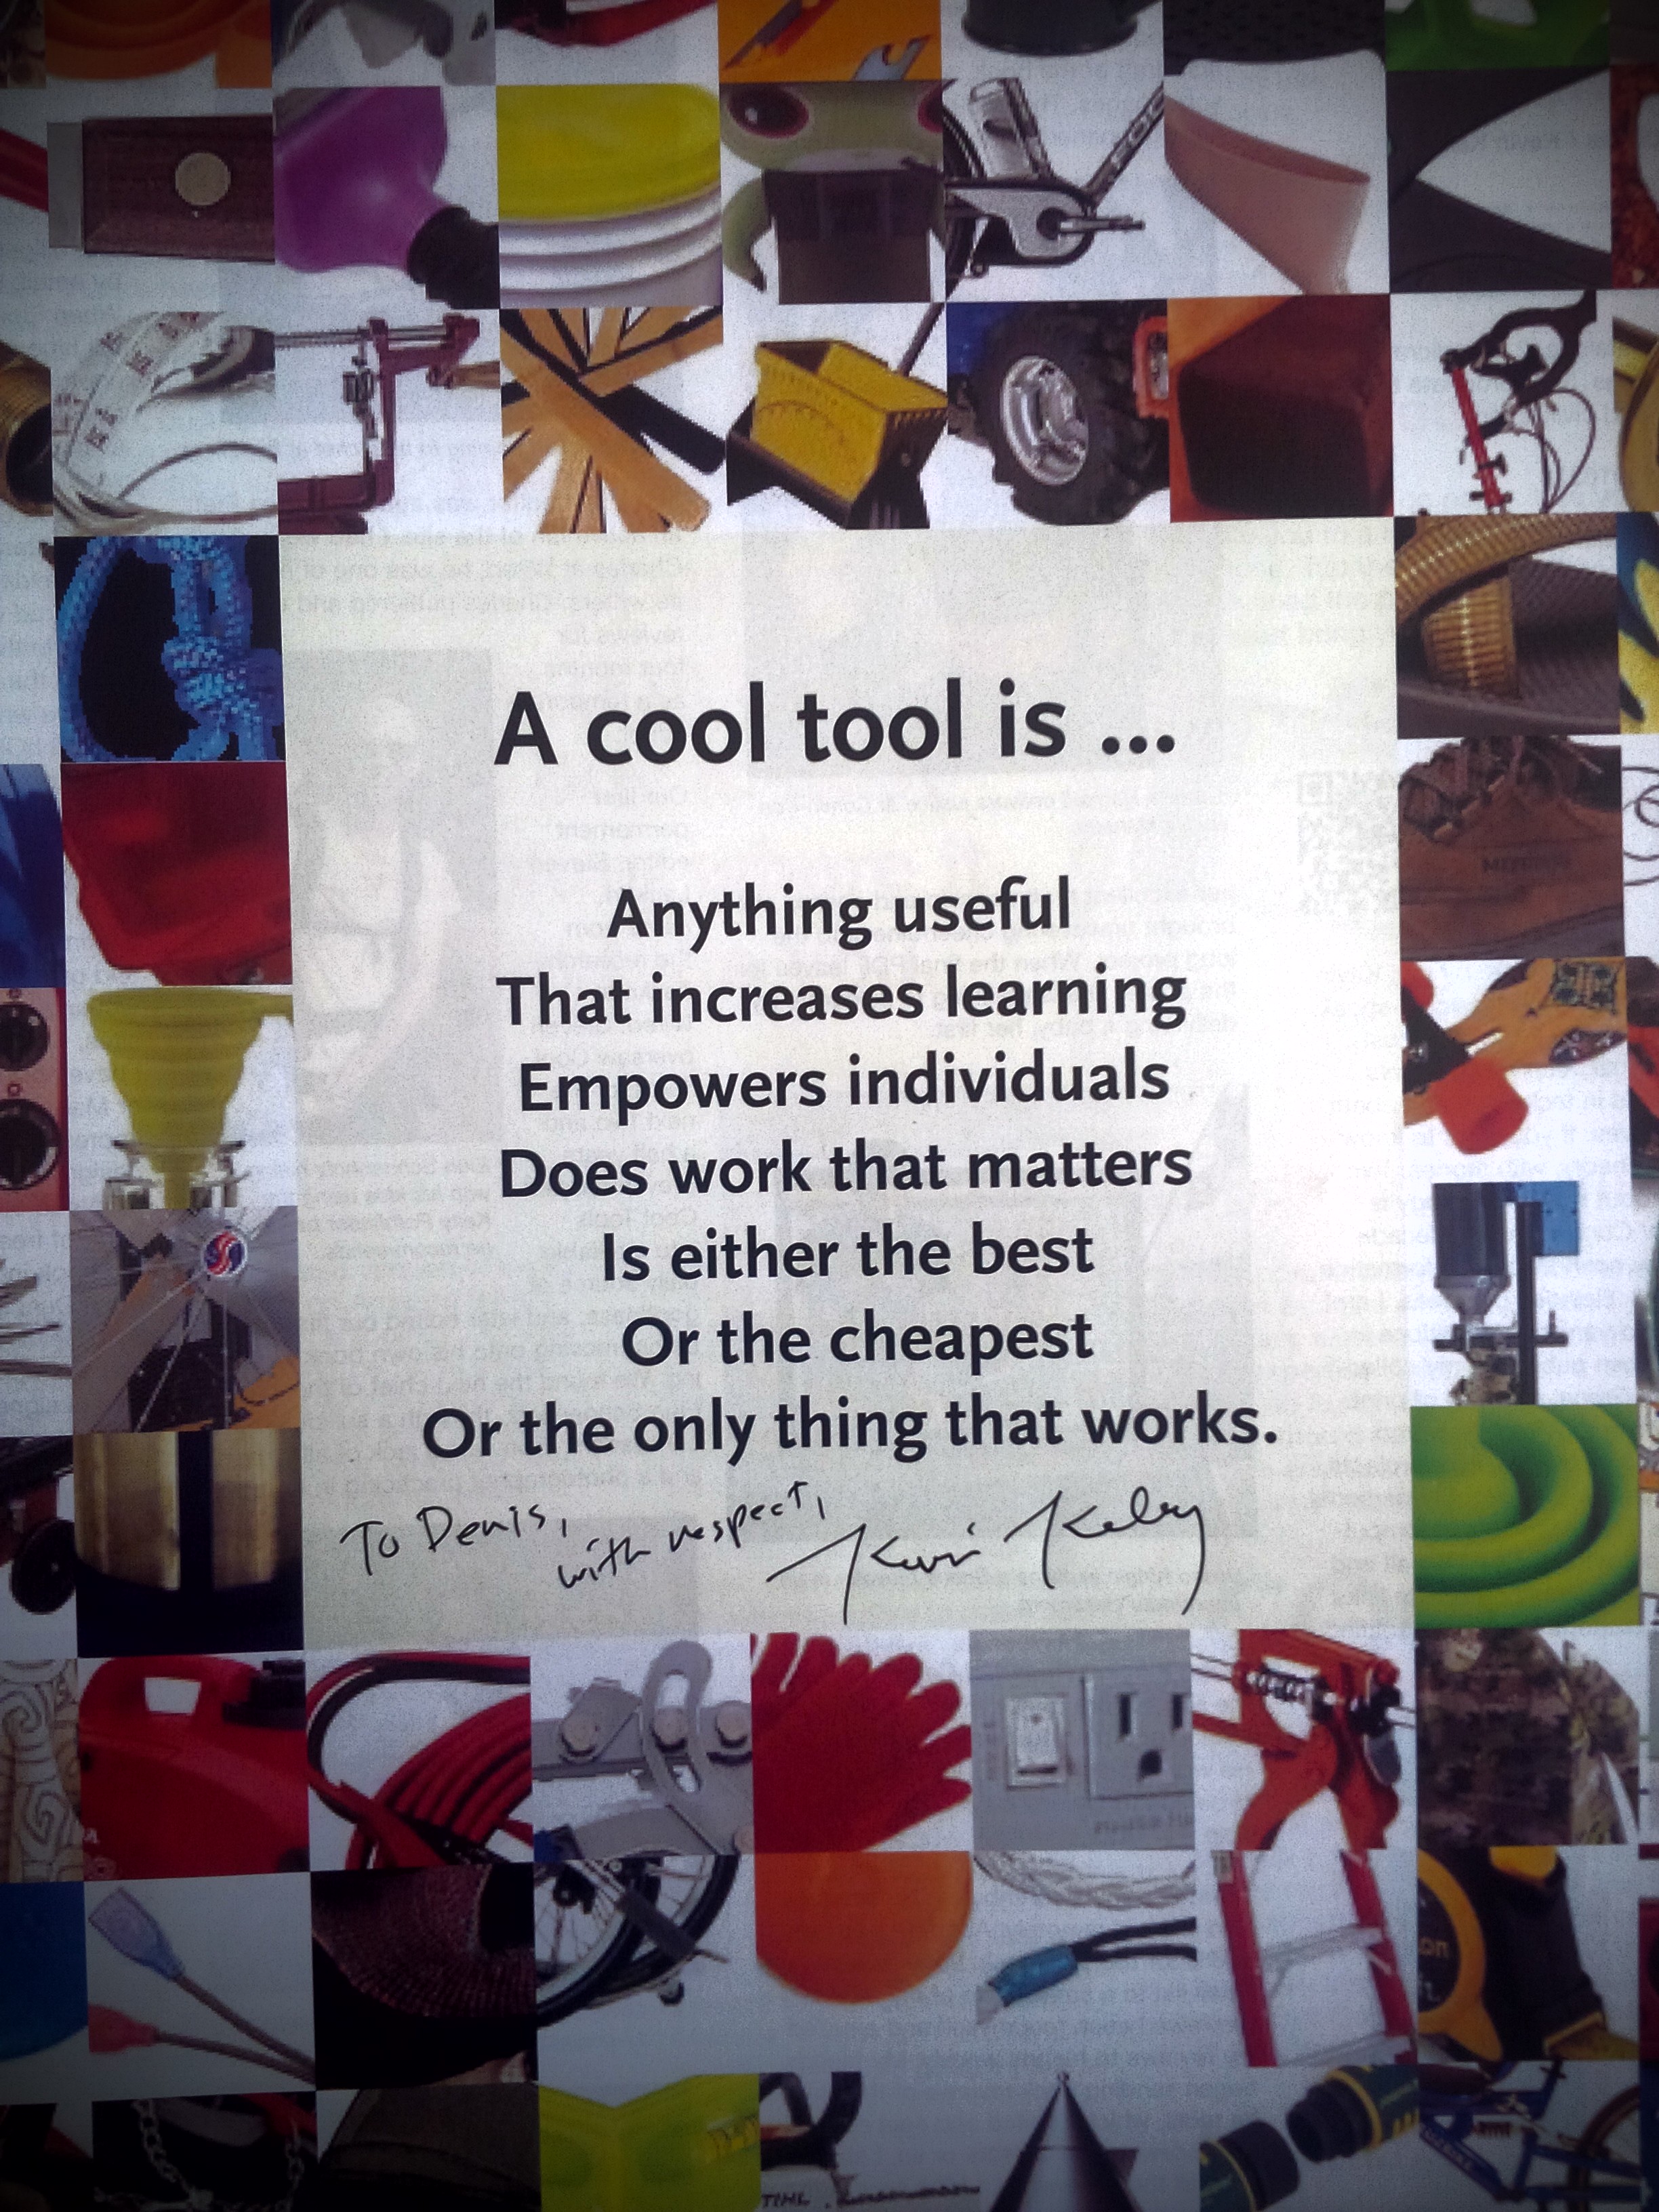
bl3I like to think of Rukuku as a tool for customizing one’s education, and that makes it a Cool Tool as defined by Kevin Kelly in his latest book Cool Tools: A Catalog Of Possibilities “A cool tool is … Anything useful that increases learning, empowers individuals, does work that matters, is either the best, or the cheapest, or the only thing that works.”

IMG_00001124_edit

And check out the very cool Styrobot, which Kevin Kelly made together with his son.

IMG_00001121_edit

If you have an hour and a half to kill, here’ s the recording of the Google Hangout broadcast: